Heading For The Dark Ages!.
Posted ontl;dr? Check the graph at the end of the post
In Egypt we are having an electricity crisis. It started in Mubrak's presidency, the dude ousted by the great Jan 2011 Revolution. After his removal, the crises started to deepen.
Morsi came to office as the president in the elections right after the revolution, and in his rule the crisis took an even worse turn. It became normal that electricity cuts off once a day for an hour. That was one of the main reasons people revolted against Morsi, and the military seized the opportunity and removed him from office and put the supreme court's president in his place for a year. Power outages were slightly improved right after ousting Morsi, but then it gradually was becoming worse and worse.
Marshall Sisi won the next presidential elections, he is the current president of Egypt and now we are having 5 or more power outages a day!!! This dude is a bloody savage and a mass murderer and if there was any justice in the world he would be considered a war criminal, but that's a story for another time!
Anyway, things were getting a lot worse without any government official having a shred of decency to come up and talk to the people about it. Not an apolgy, or a bit of information of how bad and/or how long will this go on. Not a statement on whatever measures the government put in place to solve this. Not a thing!!
Then I saw this post by my fried Tarek Amr. He wrote that the Egyptian Electric Utility and Consumer Protection Regulatory Agency (EGYPTERA) has released an online meter to show the current load status on the Egyptian power grid. He said that the meter did not provide any way to be processed programmatically, like an API, and he invited his fellow programmers to try and do so.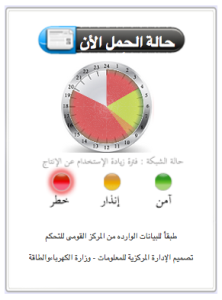
I liked the idea very much, and worked on a web application that parses the meter data and provides it as an API for other programmers to use, and open sourced the code.
Unfortunately, EGYPTERA's load meter only shows if the power is in the "Safe Zone", "Warning Zone" or "Danger Zone". It also shows the load distribution throughout the day's hours. It does not show any historical data. It does not show location specific load status. Just a load status on the entire power network across Egypt!!
After I released the api, I worte another script that used that api to save the status into a database on my online server withe a timestamp. I collected data for the past 7 days and a half about the load status every 10 minutes.
When I plotted it using D3js, the output was scary!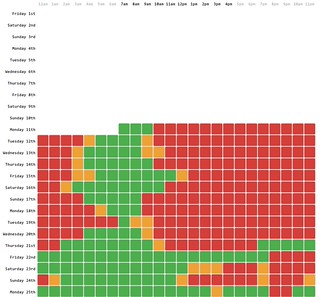
Each row represents a day, and every block stands for an hour of the day starting at 12 am and finishing at 12 am the next day.
Load level has a value of three :
- Danger (represented in red)
- Warning (represented in yellow)
- Normal (represented in green)
You can reach the load distribution graph here.
We were heading for the "Dark Ages" figuratively with all that blood spilled and corrupted governments, corrupted military, corrupted judicial system, corrupted police and corrupted media. Now were are heading for the Dark Ages, LITERALLY!!
Update 1: The application has been featured on a TV show on Alnahar Alyoum channel. Ironically the name of the channel means "The Day Light Daily" while we are in a power crisis. Here is the video link. I have been called by the program on phone from minute 17 to minute 27.
Update 2: The application now has been moved to its own domain name (www.gridstatusnow.com) and has been undergoing some UI enhancements for a better user experience.